概述
服务器性能是一个至关重要的评判标准,我们提供了性能分析的工具,使开发者能对引擎的性能情况做全局的掌握。本文将讲述如何使用我们提供的工具,对引擎的性能进行分析。
在之前的文章中提到了、以及等工具,我们会从引擎性能、脚本性能、网络状态、事件处理等几个维度,把工具如何使用进行讲解。
引擎性能:
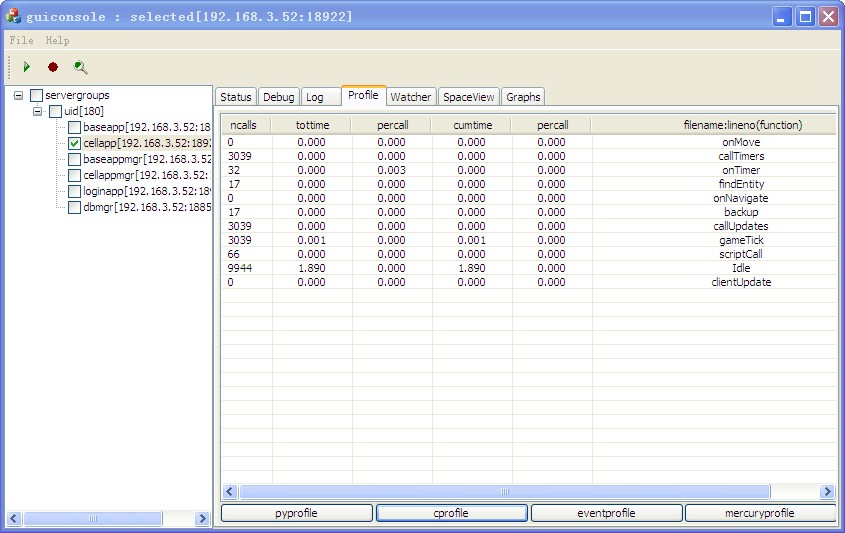
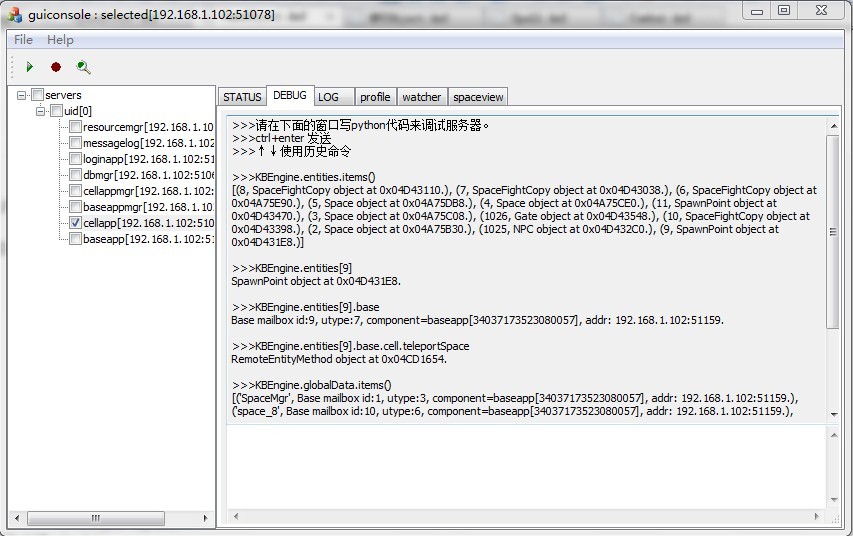
GUIConsole:
选中profile选项卡,选择cprofile,可以查看到。
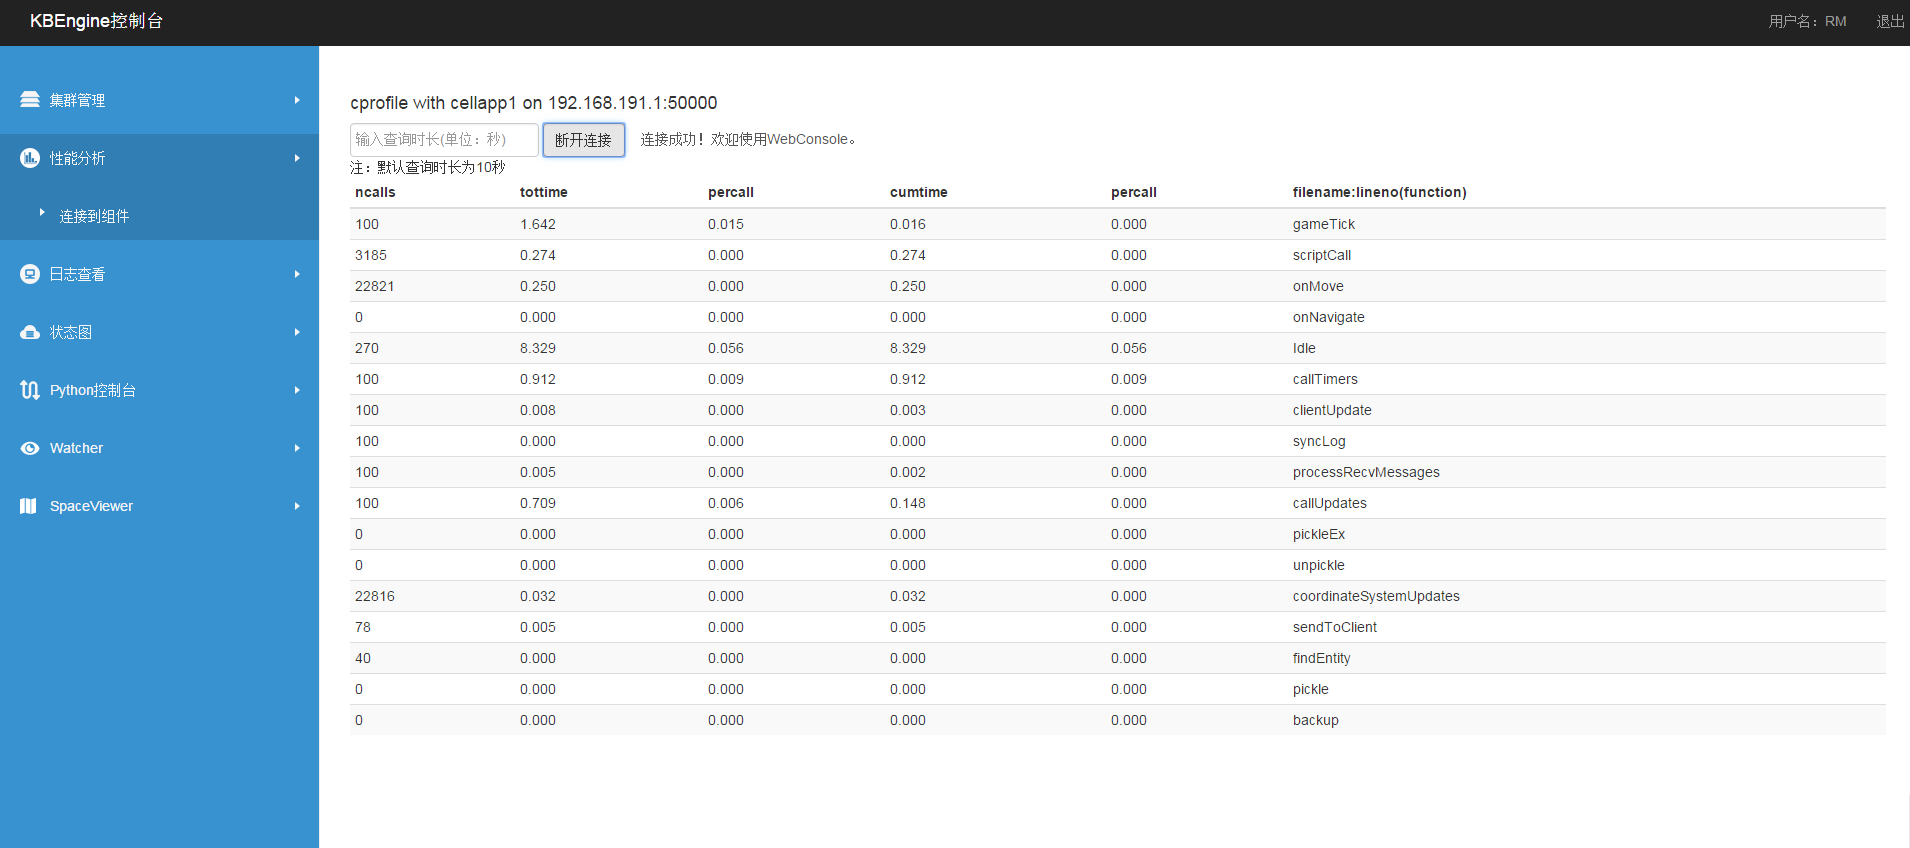
WebConsole:
选择性能分析面板,连接要查看的组件。
PyCluster
在脚本控制台使用:cprofile命令即可查看。
脚本性能:
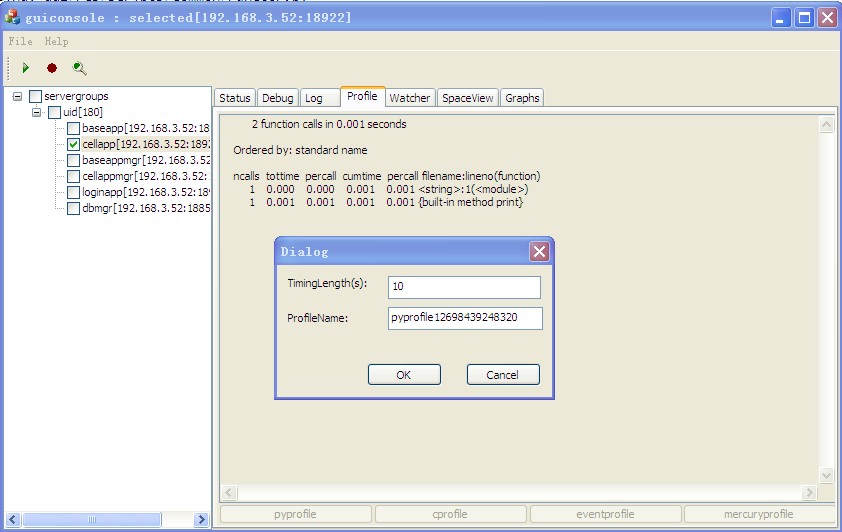
GUIConsole:
选中profile选项卡,选择pyprofile,可以查看到。
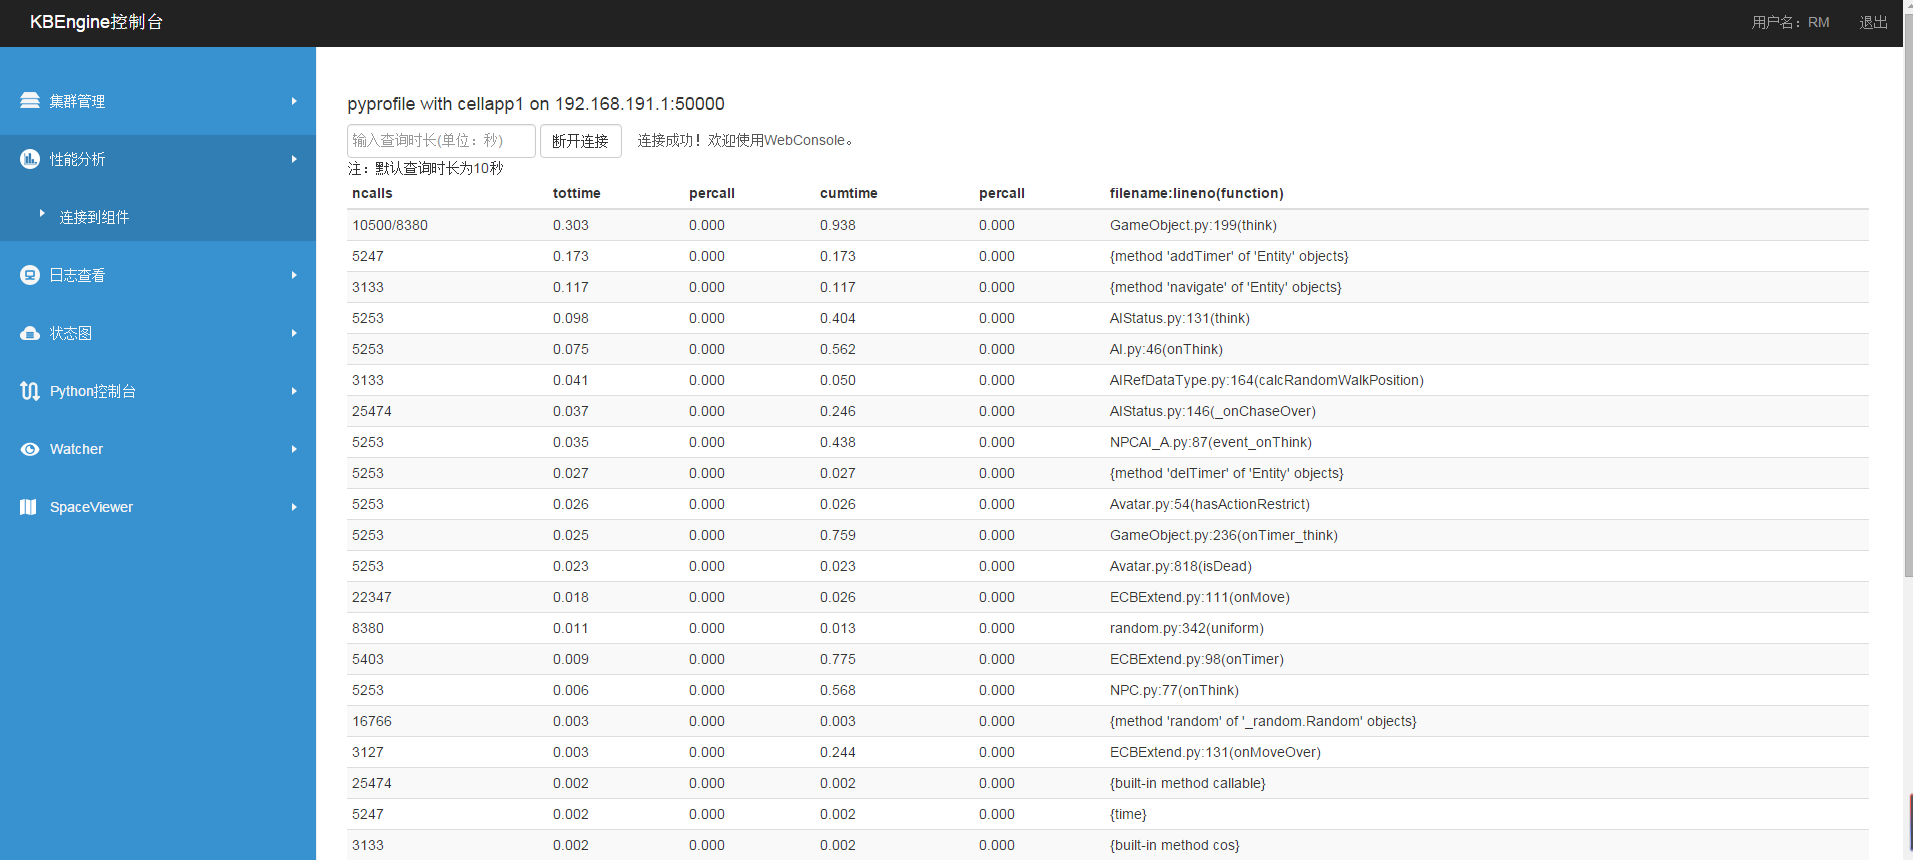
WebConsole:
选择性能分析面板,连接要查看的组件。
PyCluster
在脚本控制台使用:pyprofile命令即可查看。
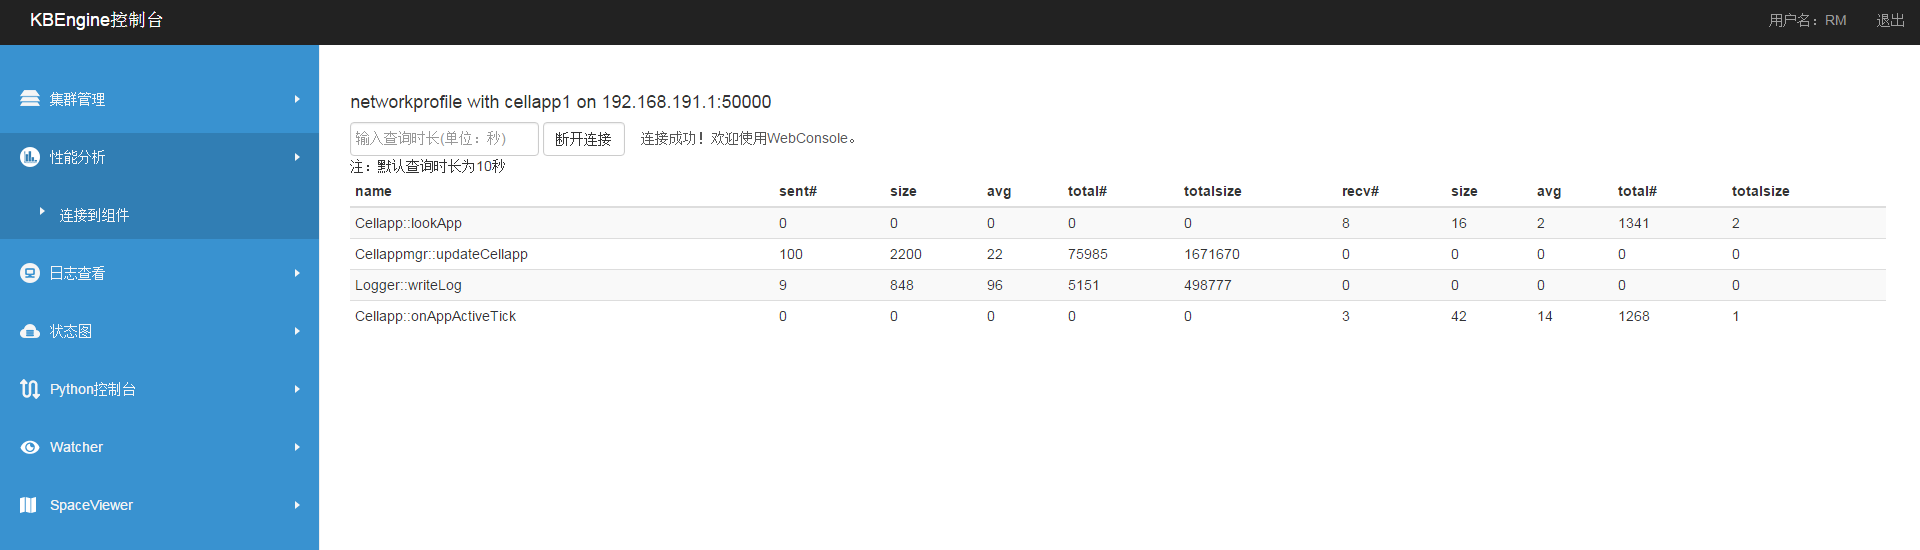
网络状态:
GUIConsole:
选中profile选项卡,选择networkprofile,可以查看到。
WebConsole:
选择性能分析面板,连接要查看的组件。
PyCluster
在脚本控制台使用:mercuryprofile命令即可查看。
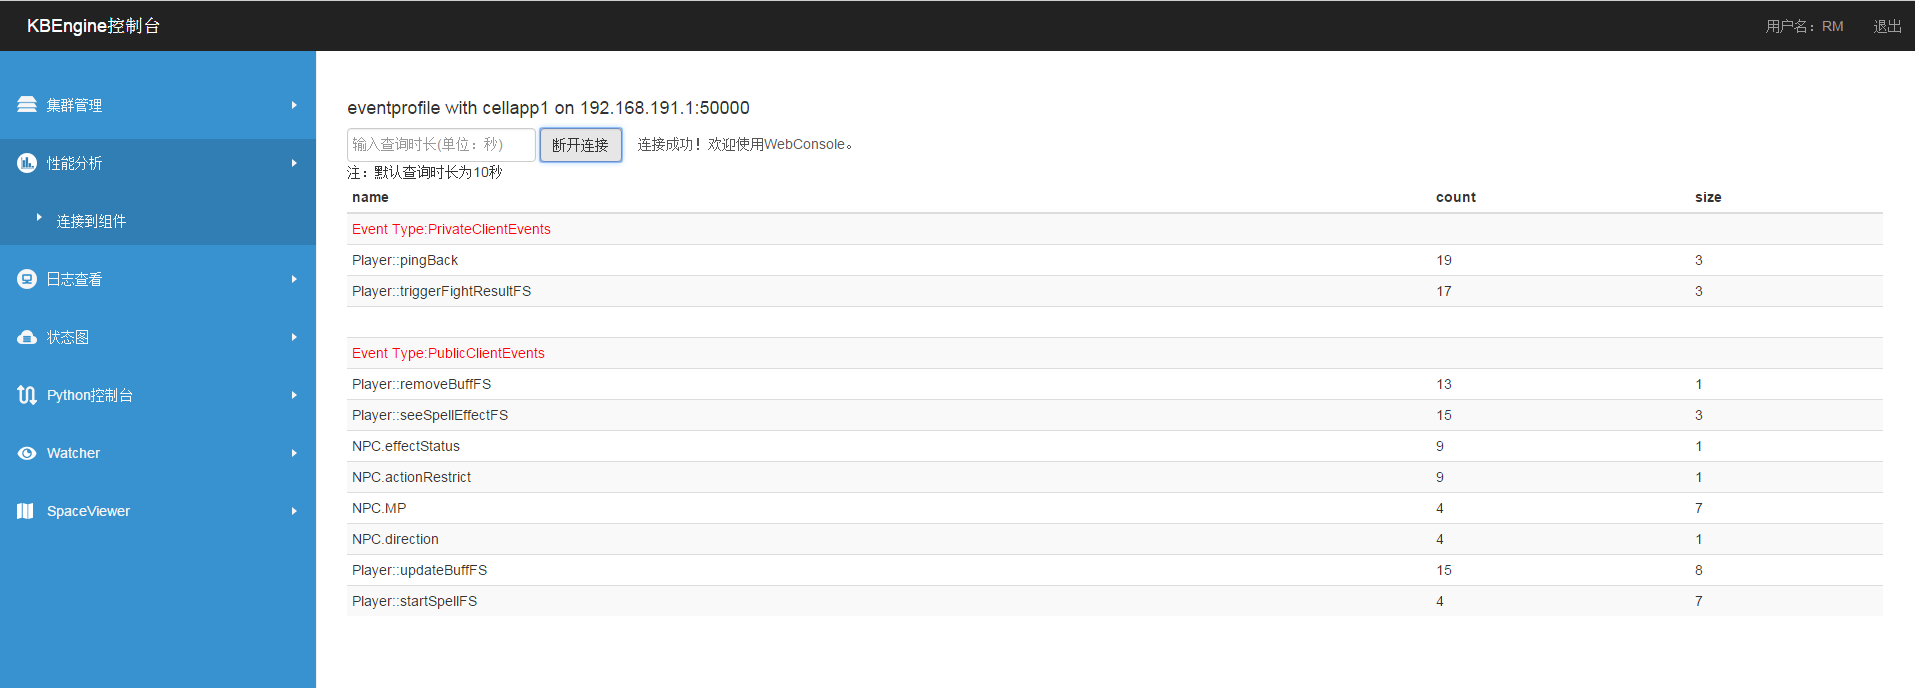
事件处理分析:
GUIConsole:
选中profile选项卡,选择eventprofile,可以查看到。
WebConsole:
选择性能分析面板,连接要查看的组件。
PyCluster
在脚本控制台使用:eventprofile命令即可查看。